Survey of Behavior of Cylindrical And Square Piers by Using SSIIM Software Under Effects of Scour
Mehdi Shekarbeigi1 * and Mohammad Sharifi poor2
1
Student of Civil Engineering School of Engineering,
Razi University,
kermanshah,
Iran
2
School of Engineering,
Razi University,
kermanshah,
Iran
http://dx.doi.org/10.12944/CWE.10.Special-Issue1.122
One of the distribution’s factor of bridges are the scour around them.In order to reduce these effects, it is essential to understand its mechanism, Materials of riverbeds are erosion, But it depends on the severity of erosion in a way that the riverbed is covered with Granist, it takes years to erosion while the Rivers with sand bed have maximum depth within a very short time, In addition to the land and rivers is the erosion which is one of the most important factors, Hydraulic factors also play an important role in the occurrence of this phenomenon, for Bridge design with high reliability and in a economically way requires accurate estimation of the maximum scour depth around the foundations. This important factor will be calculated by using Empirical equations which have been proposed by researchers, however, since most of the equations are empirical but it may not always be a good accuracy, therefore, in this article we want to calculate the maximum scour depth and factors which are affecting this phenomenon by using numerical models of SSIIM.
Copy the following to cite this article:
Shekarbeigi M, Poor M. S. Survey of Behavior of Cylindrical And Square Piers by Using SSIIM Software Under Effects of Scour. Special Issue of Curr World Environ 2015;10(Special Issue May 2015). DOI:http://dx.doi.org/10.12944/CWE.10.Special-Issue1.122
Copy the following to cite this URL:
Shekarbeigi M, Poor M. S. Survey of Behavior of Cylindrical And Square Piers by Using SSIIM Software Under Effects of Scour. Special Issue of Curr World Environ 2015;10(Special Issue May 2015). Available from: http://www.cwejournal.org/?p=11214
Download article (pdf)
Citation Manager
Publish History
Introduction
SSIIM is initial for : Sediment simulation in intakes with multi –block option ,This software is a numerical method for using it in engineering of Reviver, Environment Engineering, Hydraulics Engineering and Sediment .
The first aim of preparing this software was to Simulation exercises in channel geometry and river, Later, This software of sediment was used for other subjects of Hydraulic modeling of overflow, the energy is lost in tunnels and turbulent flow and etc.
One of the structures that damages is irreparable consequences are Bridge piers which is one of the factors contributing to the deterioration of the structural development of local scour around it.
Table (1-1): Statistics of bridge destroyed in Iran (Mahmudian Shushtarî 2007 destroyed bridges (span)
|
Interval (years) |
Number of bridges destroyed (aperture) |
|
1952-1961 |
78 |
|
1962-1971 |
648 |
|
1972-1981 |
97 |
|
1982-1991 |
5724 |
|
1992-2006 |
9392 |
The capability of the software SSIIM compared to other CFD models are the Feature modeling of Sediment transport with moving bed in a complicated geometry, this feature involves the size of sediment, hovering load cargo bed, the bed is the bed slope effects, Moderate estimate scour depth around hydraulic structures such as piers are a very important issue, Which helps us in basic design of the bridge in terms of geometry, the location of the depth of sinking to the bottom of the harness as required and is less prone to errors and to have a reliable and safe plane, lots of researchers tried to provide a relation with method that can calculate the The maximum depth of scour Around bridge piers But because of the complexity of the problem governing relations on it and a plurality of parameters influencing the progression of scour, So far, the method can accurately calculate the depth of scour balanced, has not been provided, Therefore, many researchers have turned to in Lab. methods and test results are given in the form of empirical or semi-empirical relations, however, the experimental model is time-consuming and costly, In addition, the results of the tests cannot be easily extrapolated to the real situation, thus the need for numerical models that can be precipitated by the discretization of the governing equations of the flow field and a series of simplifying assumptions about the problem, Scour the complex relations governing the phenomenon is clearly feeling the equations can be solved and more easily, one of code is a three-dimensional computational simulation of flow and sediment,SSIIM software that can make many of the phenomenon of hydraulic modeling of scour around bridge piers with high precision, the advantage of using this software to solve the three-dimensional equations of flow and sediment Which leads to fewer errors in the estimation of the maximum scour depth, Here is a comparison of flow and sediment around the base circle-shaped bridge simulation results with experimental data available , Moderate estimate scour depth around hydraulic structures such as piers is a very important issue which helps us to The basic design of the bridge that is less prone to errors In terms of geometry, the location of the depth of sinking to the bottom of the harness as required and designed to be reliable and affordable. Many researchers, have tried to provide the way that the maximum depth of scour around bridge piers can be calculated, but because of the complexity of the problem and its governing relations and the plurality of parameters influencing the progression of scour, So far, the method can accurately calculate the depth of scour balanced. Has not been provided, therefore, many researchers have turned to in Lab. Methods, the results provided in the form of empirical or semi-empirical relations, however, the experimental model is time-consuming and costly, In addition, the results of the tests can easily be generalized to real conditions, therefore, the existence of numerical models are felt so it can be changed to The discretization of the governing equations of the flow and sediment and a series of simplifying assumptions is complex relations governing the phenomenon of scour equations easier to solve, A computational codes to simulate three-dimensional flow field and sediment is the Software of SSIIM that can lift a lot of things including scour around bridge piers will be modeled accurately, the advantage of using this software to solve the three-dimensional equations of flow and sediment that causes an error in the estimation of the maximum scour depth is less.
To Create a Geometry of Problem
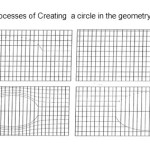
The first step is to create the geometry of the problem which is one of the most important steps because The SSIIM software has very poor graphics capabilities For example, the command creates a circle and can not be directly entered in the geometry of the problem. As shown in the picture below, for such action beginning with a simple grid with rectangular cells are created. The circle is created where it is necessary by changing the coordinates of the group, created the circle the next step can be done in one step extrapolation and place of his inner circle have grid lines, Instead, there's a way outside the circle and got to match it, the following figure obtained using the above software.
 |
|
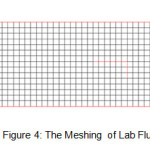
To change the size of the network near the cylindrical base, there are many options of the implementation of the model of 4cm × 4cm cells were used in the plan. After the tests have been taken to reduce the computing time and also due to the phenomenon of scour around the pier, the variables Network were used, it means that in The middle of the channel which the pier of bridge is located, the smaller cells were used and in the rest of channel, the larger cells were used, a sample network is shown in plan.
Flow Pattern Around the Base
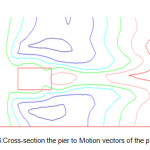
As shown below, using the SSIIM software is observed, flow lines, approached the base, the obstacle to feel around foundations have deviated and more in Return, in the mainstream and on the basis the circle swirling flow is existed.
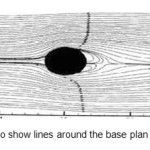 |
Figure 3: To show lines around the base plan Click here to View figure |
To show lines around the base plan, flows downward in front of the base can be seen flow lines after hitting the ground deflected downward then these stream are created, as expected downward flows has been dug after hitting the ground in front of the pit, the swirling flow inside the crater created the hole and caused depth gradually and continues until reaching the balance stage, rotating flows in the cavity, in front of basis gradually extend to the sides of the base.
And in Plan makes a form as a horseshoe, therefore, they named as horseshoe vortexes, in the figure above, dividance of flow around the bridge can be seen, the horizontal axis on both sides of the horseshoe vortices are created. Is visible. So, qualitative Study flow rate results indicate conformity with reality.
 |
|
Comparison of Scour Depth in Numerical and Physical Models
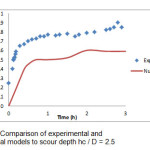
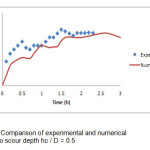
By comparing the observed results of the physical model that changes of Scour depth with Physical model has great fit (So the calculated S / D for hc / D = 2.5 is about 20% smaller than the experimental results and to hc / D = 0.5 was about 10% smaller). It can be seen that two diagrams n the early stages of scour changes in more depth with the passage of time of this amount reduced depth changes up to the scour depth is constant (The graph below is doctor's thesis for M. Najy Abhar)
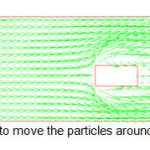 |
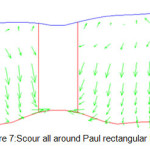
Figure 5: vectors to move the particles around the canal or flume Click here to View figure |
Table 2: Characteristics of different networks tested for sensitivity Curve Model Ratio the cell dimensions
|
% Error |
ds
|
External Ratio |
Expansion Ratio |
Total numbers of cells |
The number of cells in the vertical direction |
Small cell dimensions in cm |
Large cell dimensions in cm |
Network No. |
|
37 |
10.97 |
1 |
1 |
11.88 |
4 |
4x4 |
4×4 |
1 |
|
9 |
15.92 |
4 |
6.67 |
11776 |
4 |
1.5x2.5 |
2.5×10 |
2 |
|
.05 |
17.51 |
4 |
10 |
17920 |
4 |
2.5×1 |
2.5×10 |
3 |
|
3 |
18.07 |
4 |
4 |
160000 |
10 |
1×1 |
1×4 |
4 |
|
|
|
 |
|
 |
|
 |
|
To Survey the Scour Mechanism Around the Bridge Basis
Flow pattern around the pier shows two minutes after the start of scour, the area of Scour, it can be easily observed in the upstream pier. In each case hc / D lines in the flow upstream of the bridge bent towards the bed causing horseshoe vortex formation as one of the key factors scour around bridge piers , Horseshoe vortex creates a lot of stress in the channel bed, leading to sediment hovering particles above the base of the bridge. Sediment particles transported by the flow to the downstream side of the bridge. After crossing the bridge upstream flow lines tend to be diverted towards the bed, This causes to create a large vortex core on both sides of the bridge. also by shortens of the pier a large segment of the deflected upward and weakened vortex is formed on both sides of the bridge. About 2.5 = hc / D release vortex phenomenon can be clearly seen around the base of the bridge, while about 0.5 = hc / D
release vortex phenomenon was observed. And is shaped exactly like a horseshoe.
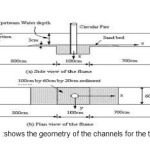 |
Figure 10: shows the geometry of the channels for the test. Click here to View figure |
 |
|
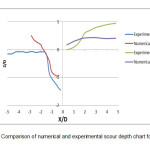 |
Figure 12: Comparison of numerical and experimental scour depth chart for hc/D Click here to View figure |
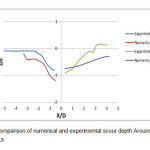 |
Figure 13: Comparison of numerical and experimental scour depth Around the x-axis for hc/D =0.5 Click here to View figure |
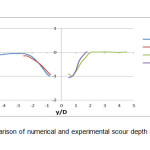 |
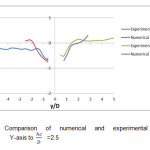
Figure 14: Comparison of numerical and experimental scour depth chart for y-axis hc/D= 0.5 Click here to View figure |
 |
|
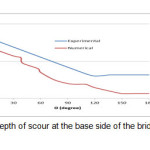 |
Figure 16: the depth of scour at the base side of the bridge hc/ D= 0.5 Click here to View figure |
Overall, the Most Important Results Are
- According to provided results, it can be understood the SSIIM software is accurate regard to ability to simulate three-dimensional flow field and sediment around the base of the bridge and takes into account effects of down ward flowing in front of the base and around the horseshoe vortices in the calculation of changes in floor level, also, Bow-wave existence is in tended in front of basis and calculates the water surface profiles, So, in similar cases the software solutions can be trusted
- The Scourmechanism is anticipated in result of the horseshoe vortex and the phenomenon of vortex release s well by the numerical
- The Anticipated scour depth achieved in side parts of the pier by existing models about 10 to 20 percent smaller than the measured values Laboratory samples. Computational results of numerical modeling potential shows for wash modeling And around an under water structures,.
- Height reduction Weakens Pier of horseshoe vortex and the phenomenon of vortex release and its observed that, if the height is reduced pier scour depth is reduced by reducing the height of the bridge is exponentially. When the bridge height to diameter ratio greater than 2 scour depth is almost independent of hc.
- Process of scour is determined through the combination of horseshoe vortex and the phenomenon of vortex release Sediments close to the upstream of the pier washed horseshoe vortex particles become hanged by the flow achieved Scour of horseshoe vortex causes a slope in front of pier and Sedimentation is seen in front edge of Scour pool to the base of the bridge, the slope of the bed scour in front of the pier always been very close to the angle of repose of the sediment. Horseshoe vortex plays Important role in this process scour in bottom of pier, When the bridge is small enough (0.5> hc / D) at the bottom of the bridge to escape the vortex scour phenomenon not observed.
- Performed surveys regard to effective parameters have showed The process of scouring increase of low rate and the in let to the up stream channel(as an example of Hydraulically parameters) And the diameter of the pier causes (as an example of geometric parameters) to increase the depth of scour around bridge
- According to received results, it can be understood that, the SSIIM software is a proper model for a good approximation of Scour depth in engineering work, so engineers can use these models in related design/plans of bridges from achieved numbers with High accuracy and reliability.
References
- Kyamansh. Hydraulics and sediment. Second Edition. Dr. Chamran University publishing Dept.(1999)
- Nozad, h. Heidarpour, M. Afzalimehr h. Control and reduce scour Plba the slot in the base. Iranian Hydraulic Conference.(2001)
- Water Engineering PhD student doctor M. Nagy Abhari Tehran University professor of soil, sediment levels depended spillovers the university professor doctor Hussein Kiamnsh Branch pamphlet Software SSIIM Hassouni Zadeh. Methods to predict scour around the pier. Thesis presented for obtaining a Master's Degree(1991).
- Bozkus. Z, Yildiz. O, "Effects of inclination of bridge piers on soouing Depth" , journal of Hydraulic Engineering, vol. 130, No.9 , pp. 905-913,(2004)
- Boehmler. E.M, Olimpio. J.R, evaluation of pier-scour measurement me thods and pier scour prediction with observed scour measurement at selected bridge sites in new Hampshire, 1995-98" , water resources investigation, report 00.4183, (2000).


